Crypto Sector Radar
A full-stack data analytics project delivering sector-level crypto market analysis and trend prediction via automated ETL, Supabase, and Machine Learning.

Crypto Sector Radar is a functional analytics prototype designed to address the lack of standardized asset classification frameworks in the cryptocurrency market. By integrating ETL pipelines, cloud databases, statistical models, and interactive dashboards, it transforms fragmented market data into actionable strategic insights, helping investors shift from speculation to data-driven asset allocation.
Core Features
Automated Data Pipeline (ETL)
Built a robust Python-based automated ETL system that scrapes data for the Top 500 cryptocurrencies daily from the CoinMarketCap API.
- Data Cleaning & Transformation: Automated handling of missing values and standardization of timestamps.
- Intelligent Classification Engine: Utilizes a priority-based rule set to automatically classify 533 tokens into 17 distinct sectors such as "DeFi", "AI", and "Layer1".
- High Reliability: Designed with idempotency to ensure stability and consistency in data updates.
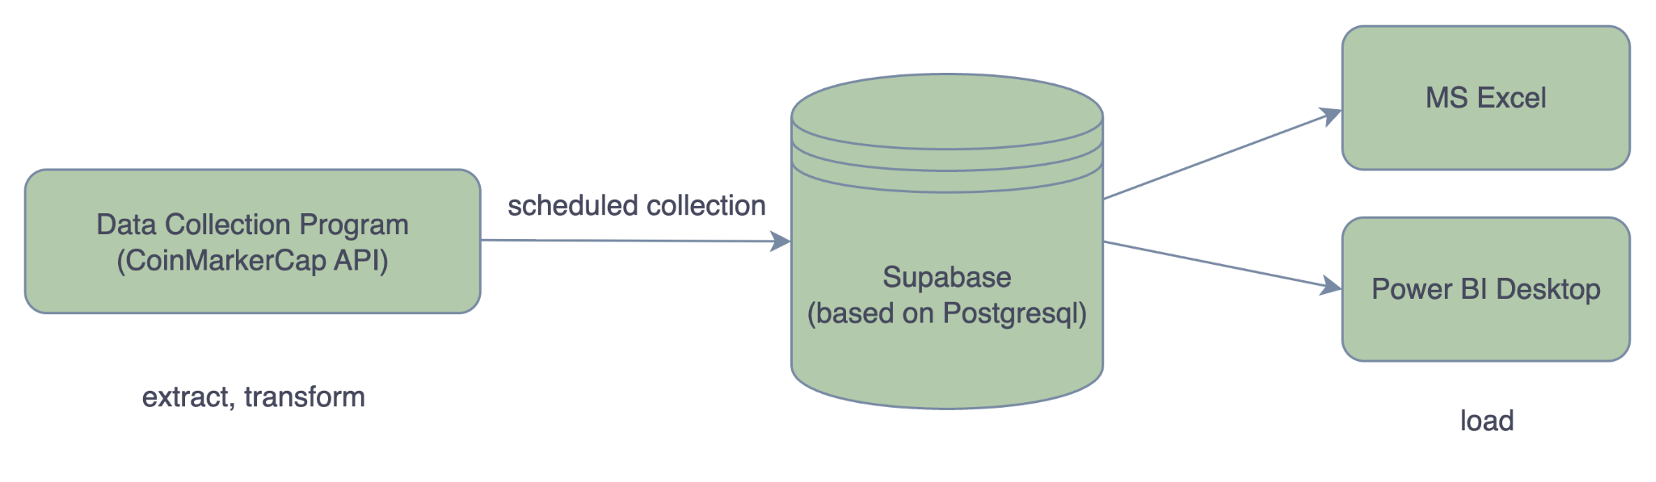
Figure 1: Data Solution Architecture
High-Performance Analytics Database
Constructed an analytics-optimized data warehouse using Supabase (PostgreSQL).
- Hybrid Architecture: Combines normalized OLTP core tables (for raw data) with pre-aggregated OLAP summary tables (for fast queries), balancing data integrity with dashboard performance.
- Security & Governance: Implemented Row-Level Security (RLS) policies to ensure secure data access.
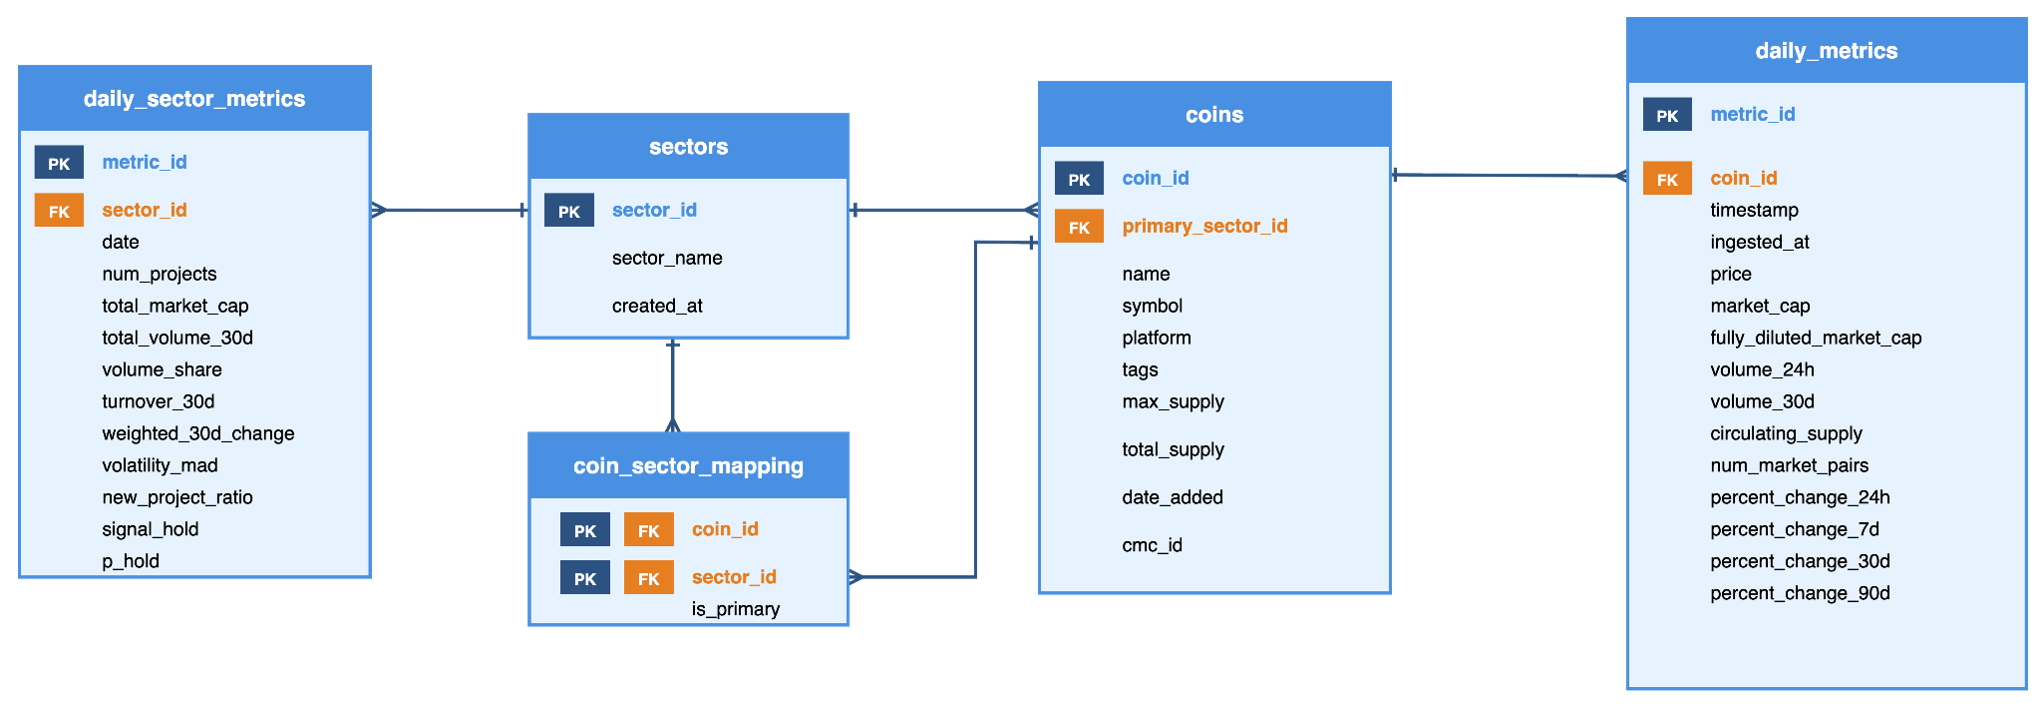
Figure 2: ER Diagram
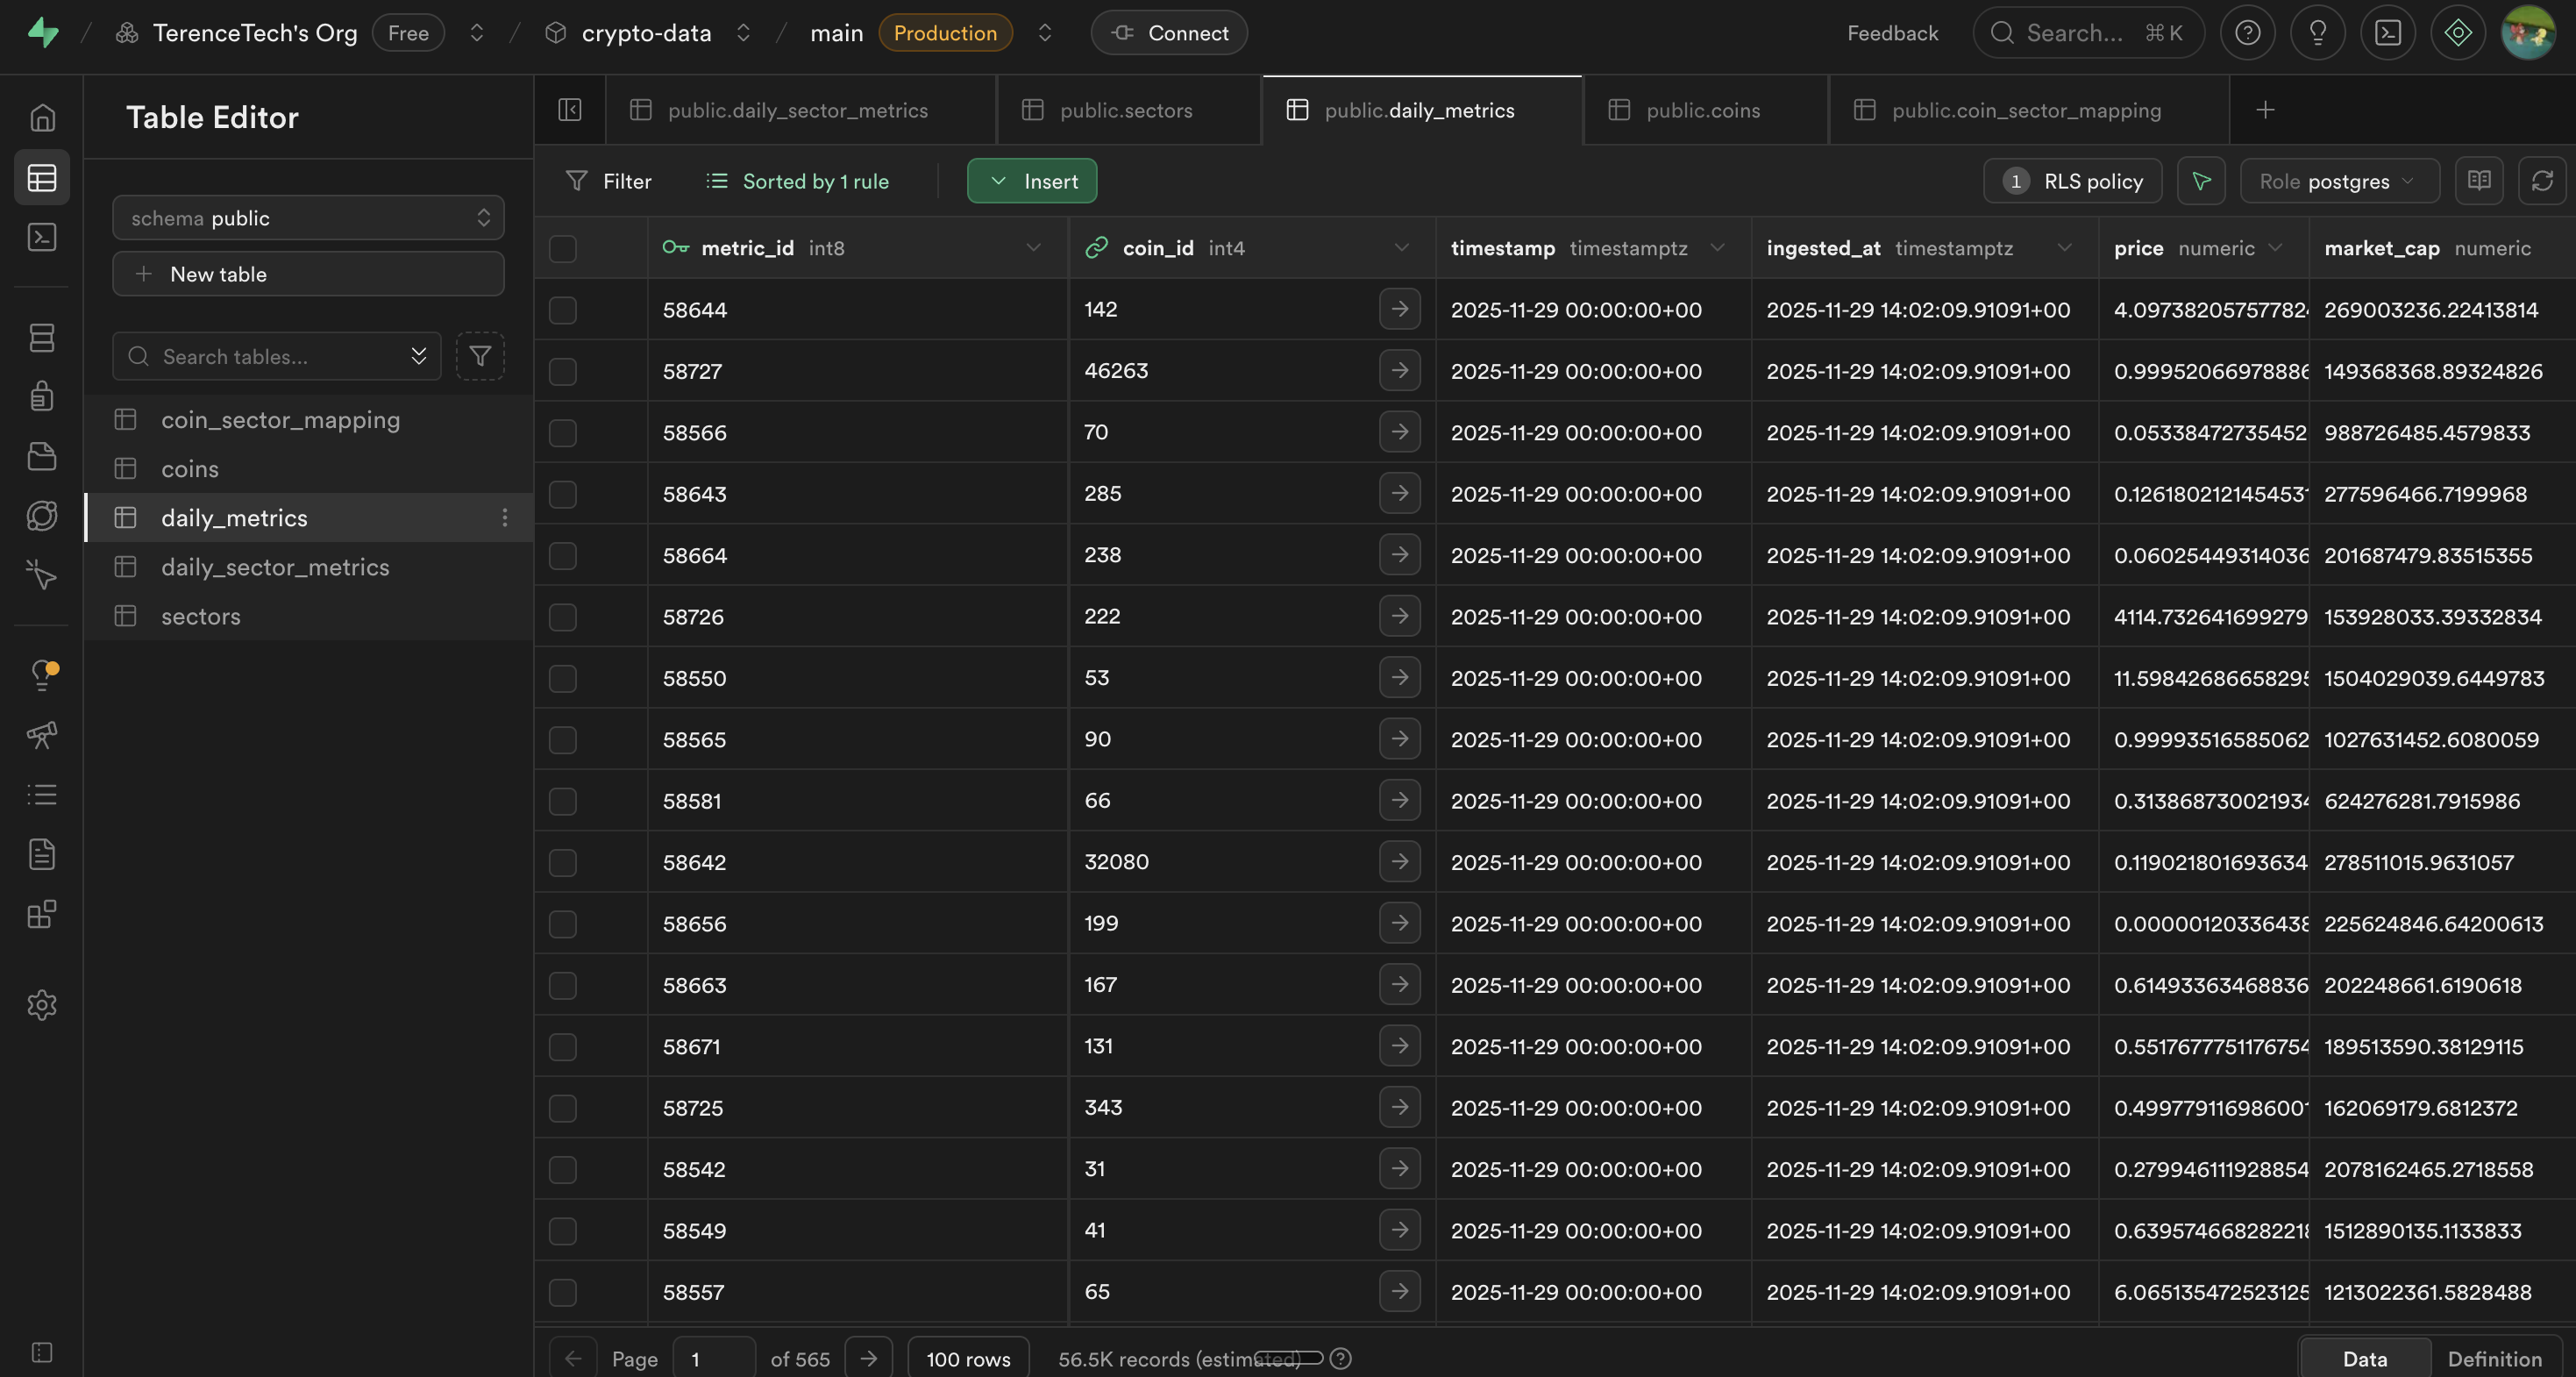
Figure 3: Supabase Database Interface
Predictive Analytics Model
Integrated machine learning algorithms to provide deep insights beyond simple descriptive statistics.
- Decision Tree Classifier: Built a highly interpretable Decision Tree model that generates "Buy/Hold" signals based on indicators like 7-day momentum and volatility.
- Key Findings: The model identified "14-day volatility" and "7-day sector momentum" as the most critical factors influencing market trends.
- Performance: The model achieved an AUC of 0.805 on the test set, significantly outperforming random chance.
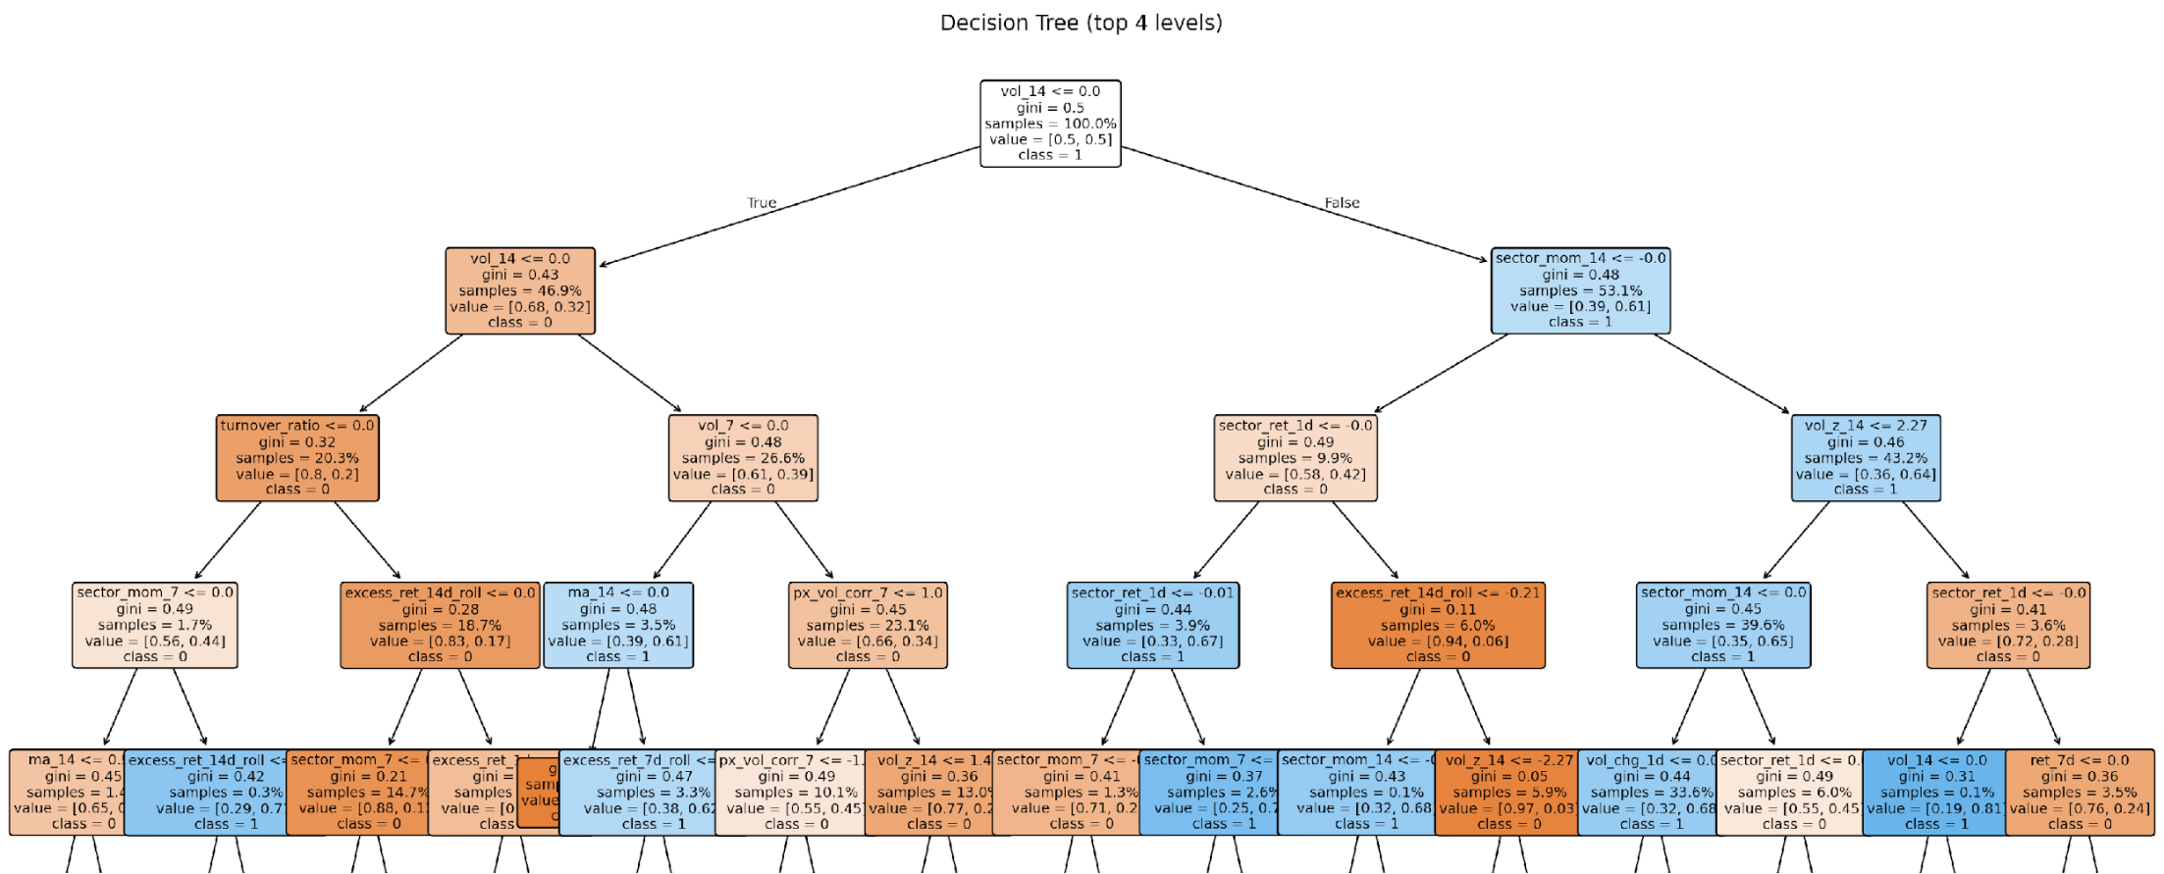
Figure 4: Decision Tree Model (Top Levels)
Interactive Decision Dashboard
The final deliverable is an interactive Power BI dashboard that tells a complete data story:
- Macro Overview: Visualizes market structure, revealing the extreme concentration where "Bitcoin Ecosystem" and "Layer1" dominate 81% of the market share.
- Trend Tracking: Captures the rotation of capital from established sectors to high-momentum emerging sectors like "DeFi" and "AI" using heat maps and stacked area charts.
- Strategic Support: Intuitively displays 30-day weighted returns and turnover rates for each sector, assisting in identifying potential investment opportunities and liquidity traps.
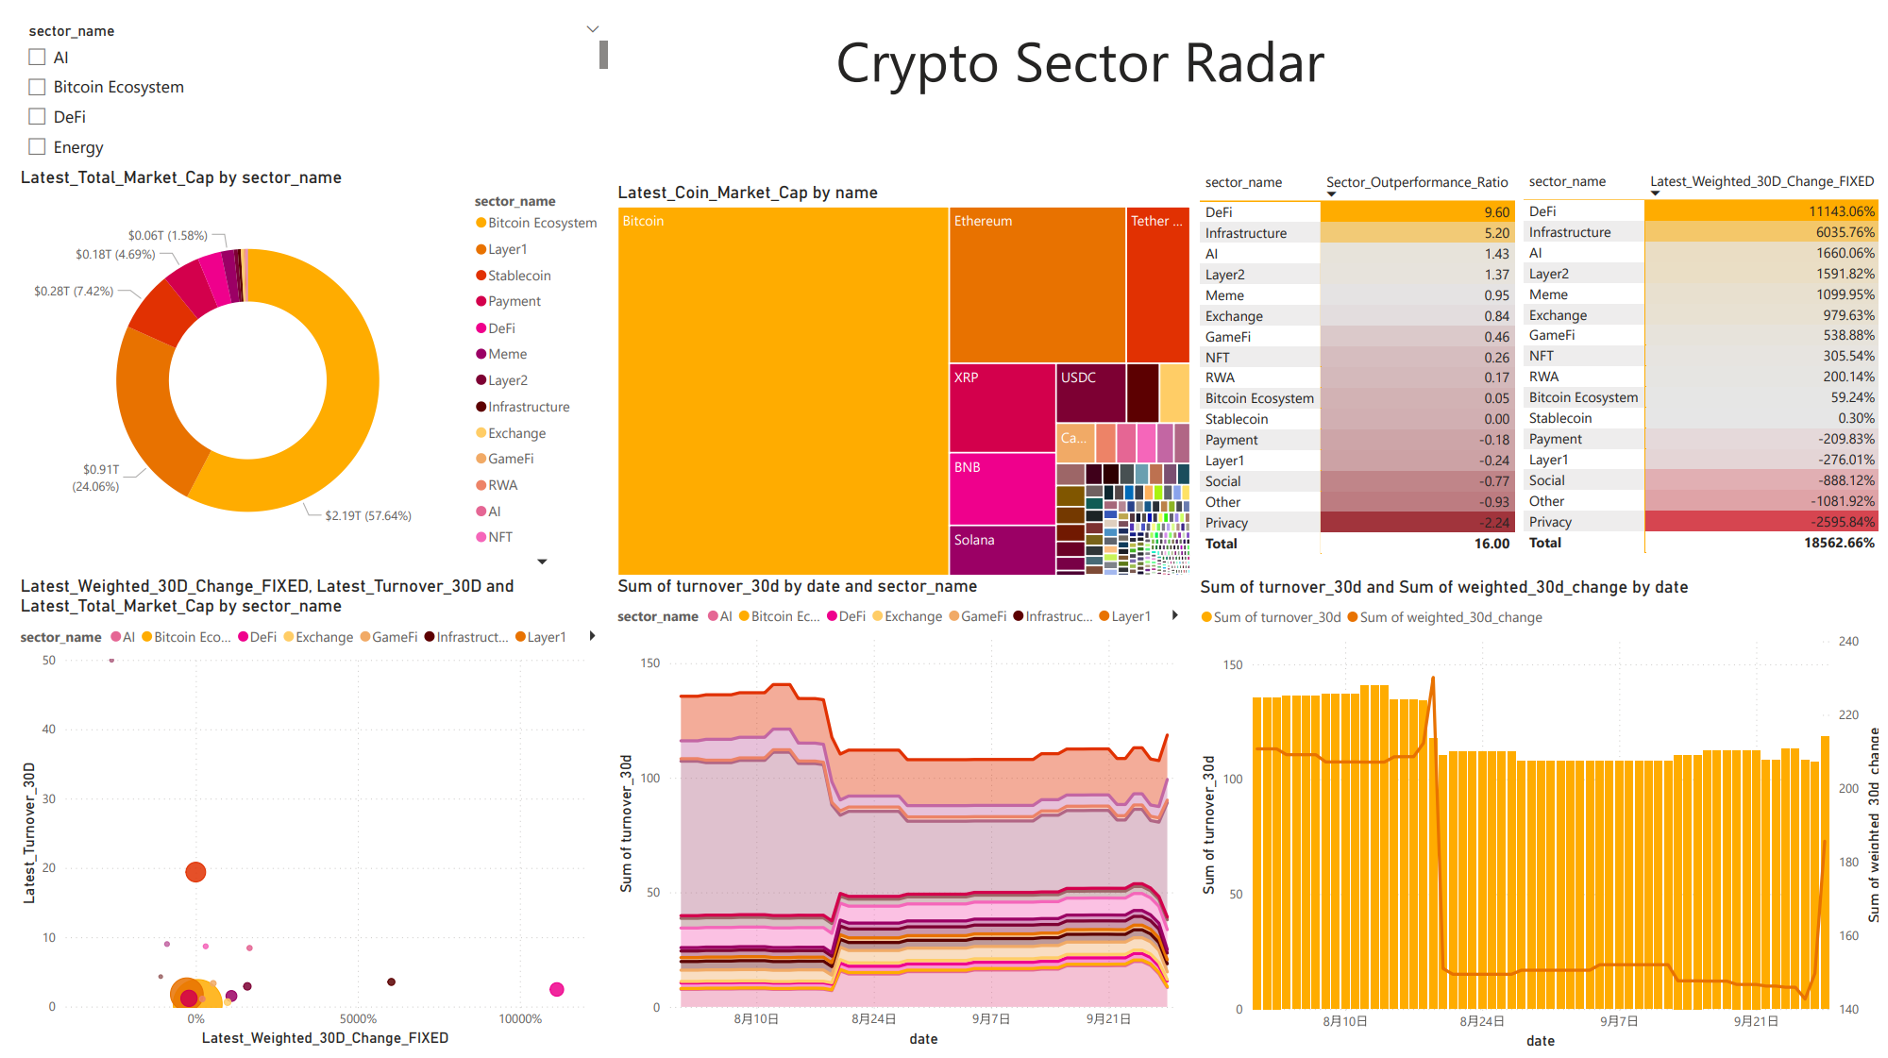
Figure 5: Power BI Interactive Dashboard
Technical Architecture
The project's tech stack covers the full data lifecycle management:
- Data Acquisition & Processing: Python (Pandas, Requests)
- Database: Supabase (PostgreSQL)
- Analytics & Modeling: Scikit-learn (Decision Tree), Statistics
- Visualization: Power BI
Project Impact
This project is not just a technical implementation but a complete business analytics solution. It successfully processed over 30,500 daily metric records, transforming chaotic market data into structured sector insights.
Key Insight: Analysis shows that while the market is dominated by large caps, emerging sectors like DeFi and AI exhibit extremely high short-term excess returns and capital inflows, validating the effectiveness of a "Sector Rotation" strategy.
Future Outlook
While the current rule-based classification engine performs well, future plans include introducing NLP models to dynamically analyze project descriptions for more flexible asset classification. Additionally, integrating on-chain data and social media sentiment is planned to further enhance the predictive model's accuracy.